The Challenge
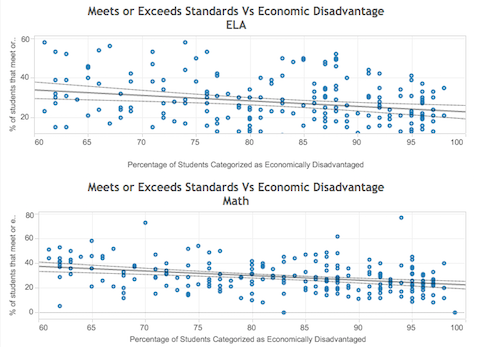
California’s Department of Education provides a rich store of data, and the 2015 California Assessment of Student Performance and Progress were no exception. After the results were released, local educators wanted to know how schools and districts in San Diego county performed, with a special emphasis on high-poverty schools.
The Solution
After loading the 2015 data into our data warehouse, we produced aggregated data files and created a Tableau visualization.

