Eric Busboom.
The SIR infection model is a simple set of differential equations that describe how a disease can spread under very homogeneous, stable conditions. The model gets it’s name from the three “compartments” for people in diferent conditions:
- Susceptible: people who can be infected.
- Infected: people who are infected.
- Recovered or Removed: people who were infected, and can’t get infected again.
There are many good overviews of the model online, so in this brief analysis, we will just use the model to visuaize what happens when the $R$ parameter for an epidemic changes.
$R$ is the “effective reproduction number” of a disease, which describes the rate of increase of infection for curent conditions. It differs from the similar number, one most people are more familliar with from recent press, the basic reproduction number $R_0$, in that $R$ can change, but $R_0$ cannot.
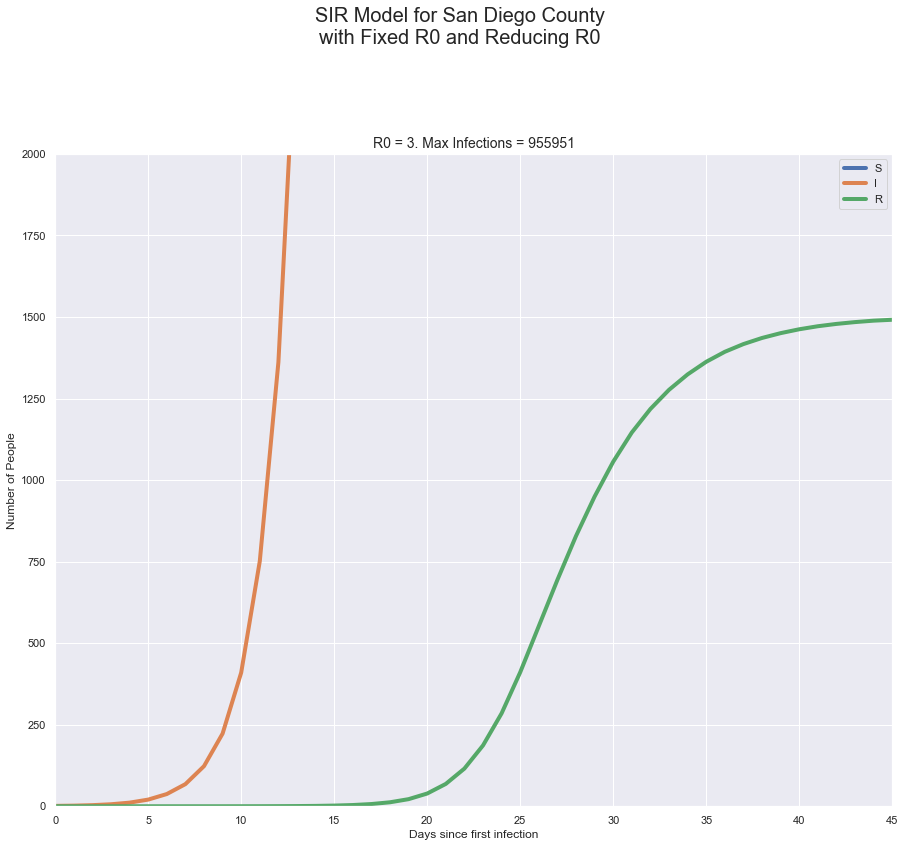
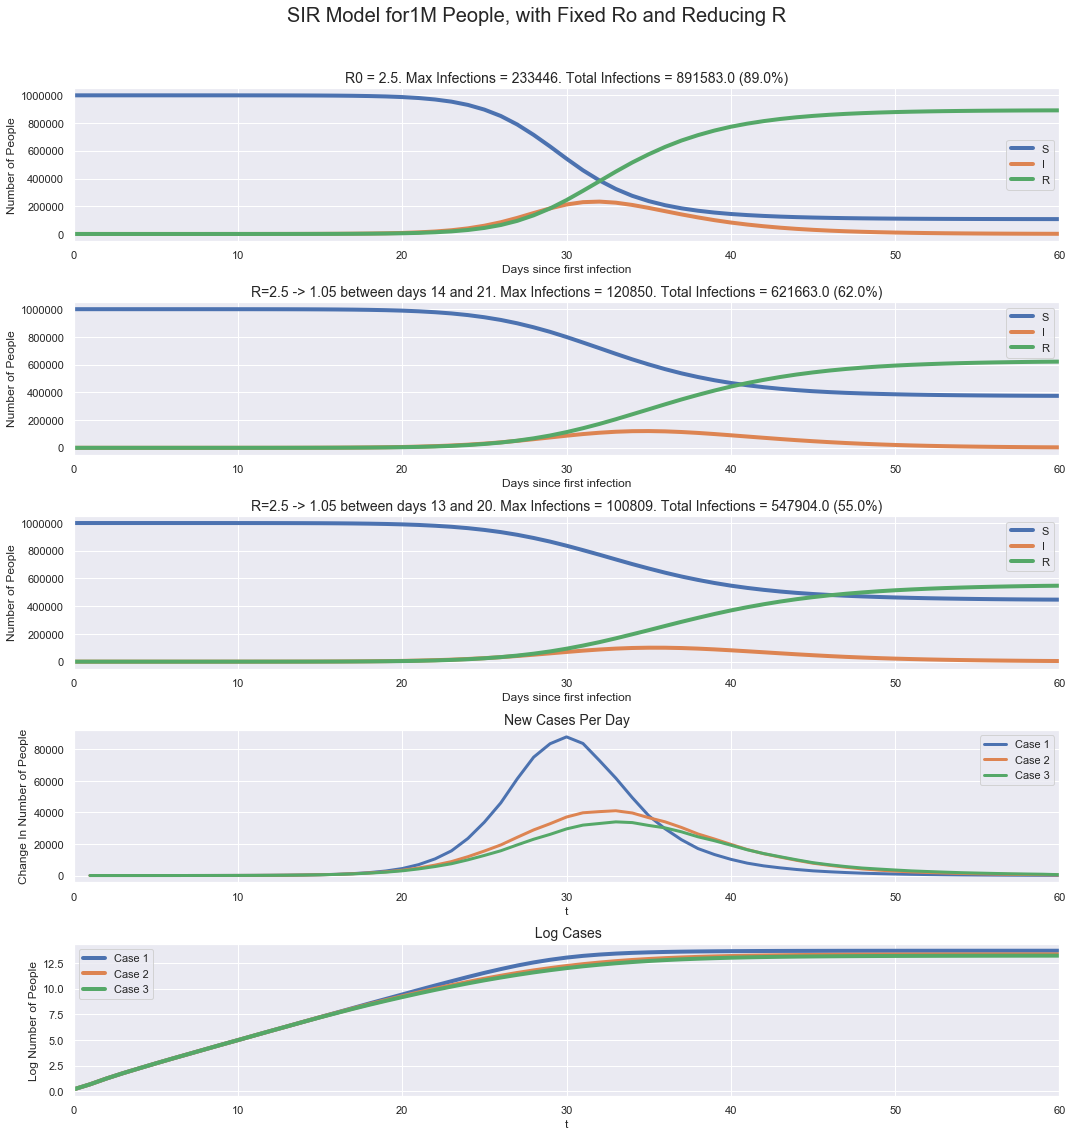
The SIR model doesn’t use $R$ or $R_0$ directly; it uses an infection rate $\beta$ and recovery rate $\gamma$, and $R_0$ = $\frac{\beta N}{\gamma}$, where $N$ is the total population. In this simulation, we’ll use the SIR model to see what happens when a population the size of San Diego County gets one infection, with one case with constant $R_0$ and other cases where $R$ changes from $R_0$ to a lower value. We will change $R$ by changing $\beta$ and leaving $\gamma$ constant, which is a simple simulation of San Diego implementing a social distancing policy.