Data is useless without metadata, the “data about data” that provides information critical to finding, understanding and using data. Developing a data library requires establishing what metadata should be collected and presented to users. For the CHCF library of health data, metadata will be used for:
- Searching. Providing titles, keywords and other information for users to find the data they need.
- Acquiring. Documenting the locations of public use data, or rules for how to access restricted data.
- Using. Descriptions of the structure and limitations of the data that are required for use.
This documentation explains the categories and some specific values of metadata that we will collect for a library of health data. The model is oriented toward the needs of researchers, sophisticated data users and are looking for primary datasets. The model does not directly address end users, who are not frequent data users and are looking for quick answers, charts or tables. However, the metadata required for researchers is also useful for creating search systems for end users.
Searching for data
Searching for data is a complex task, because there are many concepts that are hard to compose search terms for. To understand these concepts, it is helpful to present a typical scenario for how a researcher searches for data.
The researcher usually starts with a specific topic area or a variable. Researchers are generally familiar with the topic area, and are likely to know significant keywords, such as “Diabetes,” “Incarceration,” “Homicide,” or “Mortality.”
Experienced researchers are likely to know the preferred source for the data, which serves to restrict search results; data about diabetes from the CDC will most likely address prevalence or mortality, while data about diabetes from the California Office of Statewide Health Planning and Development is likely to address cost of treatment.
The researcher will also likely have an idea about the coverage and granularity of the data. Coverage is the smallest boundary that contains the data, in either time or space, For instance: “San Diego County, 2005 to 2010” specifies coverage in both time and space. Granularity is the units of the data or what it is about. A dataset about school test scores can have records for individual schools, or it could average all of the schools in a city. In the first case, the granularity is a school and the second it is the city.
Laypeople usually want the data to have the granularity at the level at which they compare things. If the goal is to have a chart of the poverty rate of counties, the user will want the data to have a granularity of counties. Researchers, however, often prefer to have the data at the lowest granularity possible. For non-aggregated data, the fundamental granularity is the entity, an individual person, school, hospital, or other noun. ( Entity-grain data is commonly known as microdata. ) For geographically aggregated data, the preferred geographic granularity is usually a census geography, so the data can be linked to census variables and studied for variation, with typical preferences being census blocks, block groups, tracts or zip codes.
Entering Search Terms
Because Google search has been prevalent for more than a decade, web users are familiar with search systems that look for terms in a document. So, a search for data, should also start with the user entering free-form search terms. The terms the user enters may address the topic of the data, or other aspects such as coverage, source or file formats. Here are some examples of freeform search terms:
"Diabetes Rates"

"Diabetes mortality"

"Diabetes rates by county"

"Diabetes rates by county in census tracts"

"Diabetes rates by county from 2010 to 2012"

"Diabetes rates from CDC by tract for San Diego County from 2001 on with income. "
Some of these terms are difficult to handle correctly, and will require specially structured metadata. For instance, in “Diabetes rates by county”, the phrase “by county” implies that the geographic granularity of the data is a county. To correctly return results for this search requires that the dataset have a document associated with it that has the phrase “by county” or that the metadata for dataset indicates that the granularity is a county, and that the search system understands how to interpret phrases that include the word ‘by’.
Using Facets
After entering search terms, the researcher will want to either browse the results, or restrict the search results using facets. A facet is a variable in a classification scheme. Online shoppers are familiar with product search sites that allow users to specify the manufacturer, price range, color, or other parameters that are specific to a class of product. Faceted classification and search can also be used for data, and there are many facets to be considered.
For a small number of results, less than 10, browsing is easiest, as researchers are adept at quickly scanning search results. But data searches can often return hundreds of results. For instance, a search for “income” on the US Census will return dozens of tables for income measures, one for each state, for each census summary level, across multiple years, producing thousands of results. In this case, the researcher will want to restrict the results using facets.
The following facets are the ones that produce the widest variation, and so are most important to allow users to restrict:
- Geographic coverage, the smallest named area that encloses all of the data points. Coverage is almost always one of national, state or county, and the coverage can usually be inferred from which agency produced the data.
- Geographic granularity, the smallest named area, or a point, that are associated with a measurement. The smallest area to which microdata records are aggregated.
- Temporal coverage, the time span from the earliest record to the latest.
Many other facets may be included in a data search engine; any metadata variable that has a discrete value – counties, years, file formats, cost, etc – can be used as a facet.
Note that the search terms may contain terms that indicate facets. The phrases “by county”, “from 2010 to 2012″ and ” for San Diego County” indicate facets. As search system that is designed for data should extract these facets from the search term and automatically apply the facet restrictions to the result list.
So, the search process in terms of generally time ordered steps is:
- Enter search terms that identifies terms and keywords. ( And, possibly has terms for facets, used in later steps )
- Get a search result that shows the results for the terms, and collects and displays the granularity and coverage values for the returned results as facets.
- User restricts the search terms using facets.
- User selects datasets for deeper review
- If dataset is not desired, return to step (2) or (3).
Significant Keywords
There are some keywords that have special meaning and should be boosted in search results, particularly when they describe something important about the character of the dataset. For instance, “Mortality” is very often a defining characteristic of a dataset; the set is not just about a disease, it’s about deaths from the disease.
“Crosswalk” has similar significance, often meaning a very specific type of datasets that connects other datasets or maps from one geographic structure to another.
Some other important terms:
- rate
- mortality, death
- prevalence
- “by” preceding “race”, “city” etc.
To determine a more complete list of significant keywords will require analysis of actual data searches.
Metadata for Searching
Some of the metadata that is most valuable for searching includes:
- Topic. Topic, title, keywords
- Geography: Geographic coverage and granularity
- Time: Temporal coverage and granularity.
- Source, the agency or organization that produced the data
- File formats
- Data Dictionary, names and descriptions of variables
- Data Documentation.
The data dictionary is used to extract the names of variables and their descriptions, which serve as high-value keywords. The documentation can be employed in a full-tech search, where the user’s search terms are used to find a document ( using the same process as Google employs ) and the resulting documents are linked to their corresponding datasets.
Accessing and Acquiring Data
After the researcher has located a dataset, the next two steps are to gain permission to use the data and load the data into their analysis environment.
Datasets can have a range of access levels, from highly restricted to public. Generally, these levels are:
- Private. Researchers outside the source agency cannot get access.
- Controlled. External researchers can only access the data at a secure, non-networked research center.
- Restricted. Researchers must request approval to access the data
- Registered. The user must create an account on a website to access the data.
- Licensed. Researchers must agree to terms of use before using the data.
- Public. There are no restrictions on using the data.
For our purposes, we can ignore the Private level. Datasets that are Controlled are both rare and very well known, so any researcher that is qualified to use the data, and has the ability to travel to the research center, will already know about the dataset. So, we won’t deal with controlled data either.
Registered data is usually also Licensed or Restricted, since registration is required to enforce a license, and is also the most common way to implement restrictions.
The remaining levels can all have their metadata published to the web, making it possible to search for them. What can make these sets difficult to use is that the rules and application process for Restricted sets are sometimes not properly described so analysts can quickly determine if the dataset will be accessible. Likewise, some Licensed datasets include terms of use that are incompatible with the researcher’s intended use.
To address these issues, the dataset metadata should include:
- Access Level: Controlled, Restricted, Licensed, Public
- Contact information for the person who controls access or approves requests
- For Restricted datasets, a description of the application process
- For Licensed datasets, a summary of the major terms of the license, or restrictions on use.
- For Registered Data, links to the account creation page, and links to the dataset that are active after the user logs in.
- Links to web pages with the application process or license.
These metadata do not need to be indexed for searching, but should be easily found on a summary page about the dataset.
Using Data
The primary information required to use a data sets are the data dictionary, which describes the variables, and use documentation, which described how the data was collected, how it was processed, and caveats or restrictions. Other information that is important for use includes:
- Data dictionary, schema
- Use documentation
- Provenance
- Other relevant background, research
- Contact information
- Use policies & Restrictions
A User Interface for Data Search
When users search on the web with a search engine like Google, they typically follow a two-step process. The first is to construct a search query for Google to return an initial set of results. The second is to scan the results, using search criteria that could not be included in the search query.
While there are many possible metadata that can be collected and cataloged for public datasets, there are only a few that are important in the first step of the process, constructing the search query. The most useful of these metadata are:
- Topic of the dataset
- Granularity
- Geographic bounds
- Temporal bounds
- Variables
- Categorical values
- Source
The other metadata that were presented earlier are still valuable for search, but they are more likely to be used when scanning results, rather than when constructing a search query.
The topic of a dataset is represented by the index title, summary, keywords, subject and category of the dataset. These are freeform text, so standardization is prohibitively difficult.
Granularity, or Grain, refers to the type of thing that a row in the datasets records measurements for. For aggregated social data, granularity is most frequently a geographic area, usually one defined by the US Census. For microdata, the granularity can be a person, school, hospital or other entity.
Geographic bounds, or Geographic Coverage, is the area that contains the data. For social data, it is most often the smallest named geographic boundary that contains all of the data, and is usually a political, administrative or statistical area.
Temporal bounds is the range of times from the first data point to the last. For social data, it is usually sufficient to record the time as a year, since datasets are most often updated yearly.
Variables are the names of the columns in the dataset, such as age, gender, race/ethnicity, income range. For search, it is most important to record the existence of the variable.
Categorical values are the values of categorical variables. Users can use these values to find datasets that have records for specific entities, such as a particular hospital or school.
The Source is the agency or organization that publishes the data.
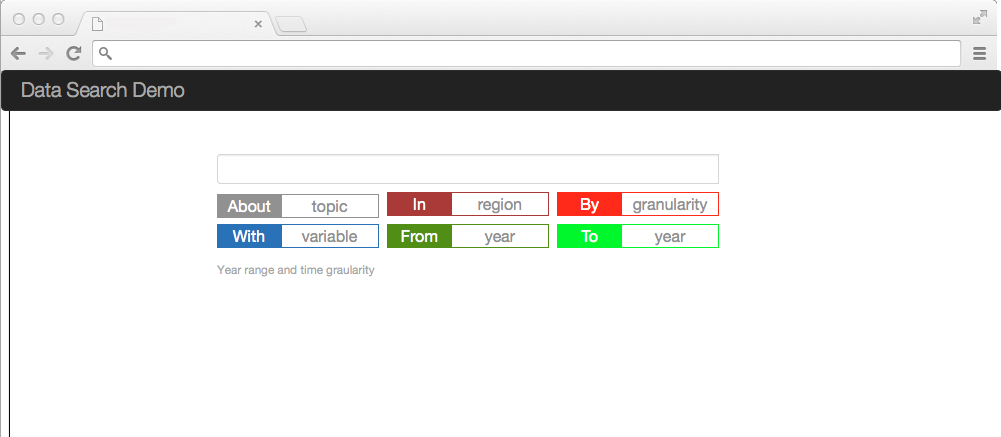
These facets can be combined in a variety of ways, with a complete search query using from one to all of them. We have designed a few variations of a user interface model that makes these facets explicit, but also allows users to enter then very quickly with a simple text grammar.
Here is a mock up of the user interface model.
The model allows the user to type in the search box to specify which facets to use, or to drag the facet into the search box.
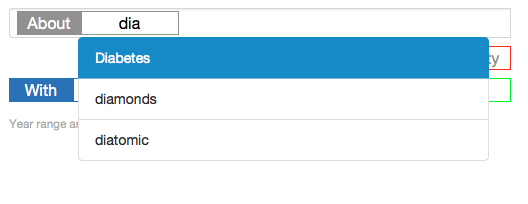
So, if the user began typing:
about dia
The user interface would turn the “about” into a gray topic facet, and open up a search as you type box showing all topics that begin with “dia”:
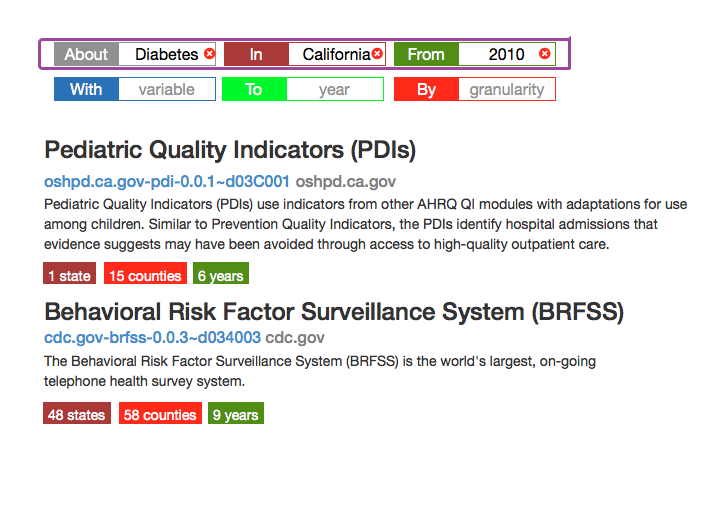
Then, the user can either complete typing, or select one of the items in the list. The interface would run searches as the user types like Google does, so after typing:
about diabetes in california from 2010
The interface would look like:
The user can type in the text phrase in any order, so it would be equally valid to type:
from 2010 in california about diabetes
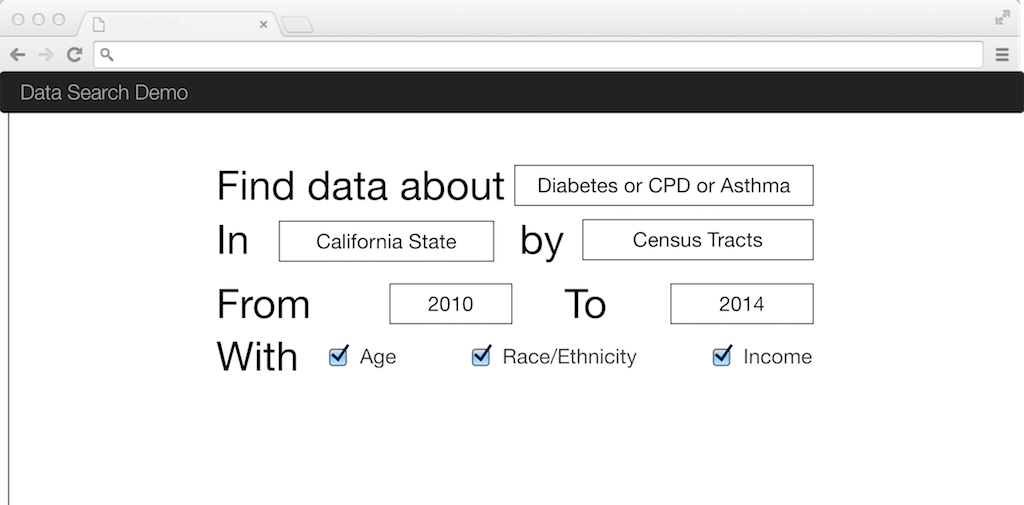
This interface is the most colorful of the alternatives we explored. Another option structures the search query as a fill-in-the-blank sentence:
This model has the same results as the first, but is less colorful and dynamic. It’s also easier to implement.
Next Steps
This research has identified a simple, intuitive model to find data that we believe is much more effective that current methods. However, the method requires collection, and manual entry and cleaning, of a significant amount of metadata for each dataset.
Civic Knowledge is working on implementing this search model, by building a web application to make the collection of metadata cost effective, and constructing the search engine presented here.
This research and design project was generously funded by the California Healthcare Foundation.


